Finnish Air Force Performance Trials on
Messerschmitt Bf 109 G-2, WNr. 14 783 'MT-215'.
English Transation by 'Hkuusela'.
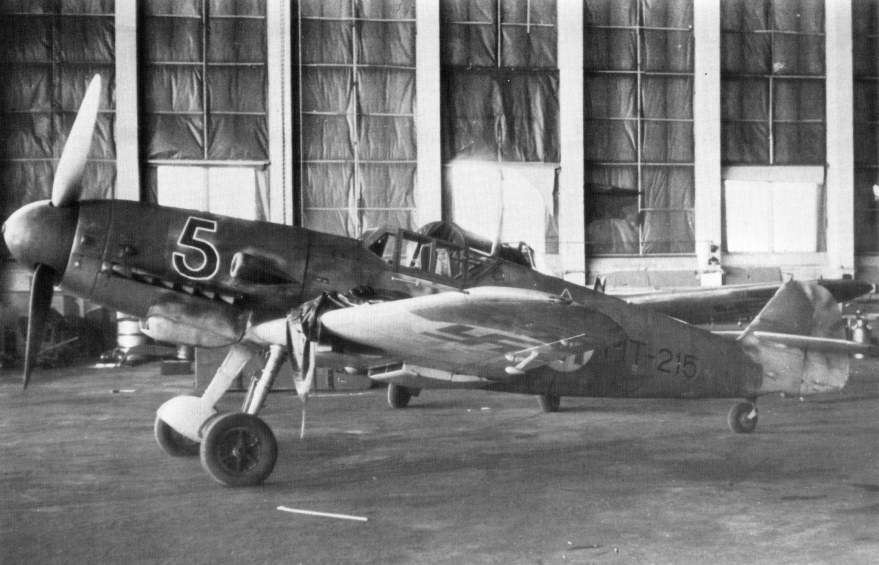
The Messerschmitt Bf 109G-2 WNr. 14 783, MT-215 in operational service in Finland. (Via Keskinen/Stenman/Niska.)
Notes
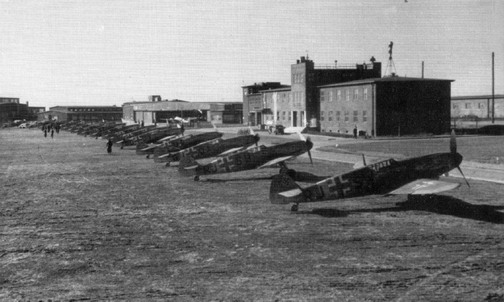 TO THE RIGHT : The first 16 Me-109-G-2
fighters ready for the ferry flight to Finland
at Wiener-Neustadt Flugzeugwerke on the 3rd of March 1943.
The third from the right, GJ + QA is soon to become MT-215. TO THE RIGHT : The first 16 Me-109-G-2
fighters ready for the ferry flight to Finland
at Wiener-Neustadt Flugzeugwerke on the 3rd of March 1943.
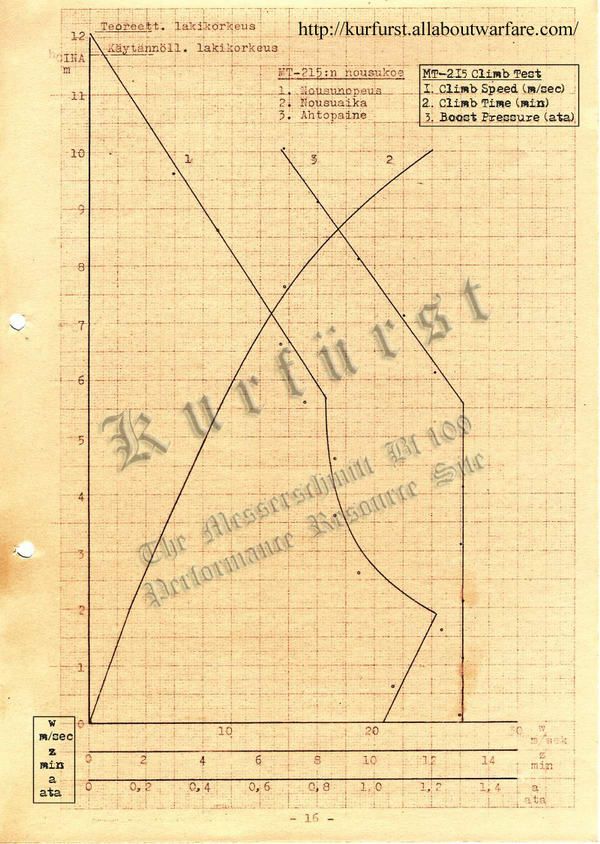
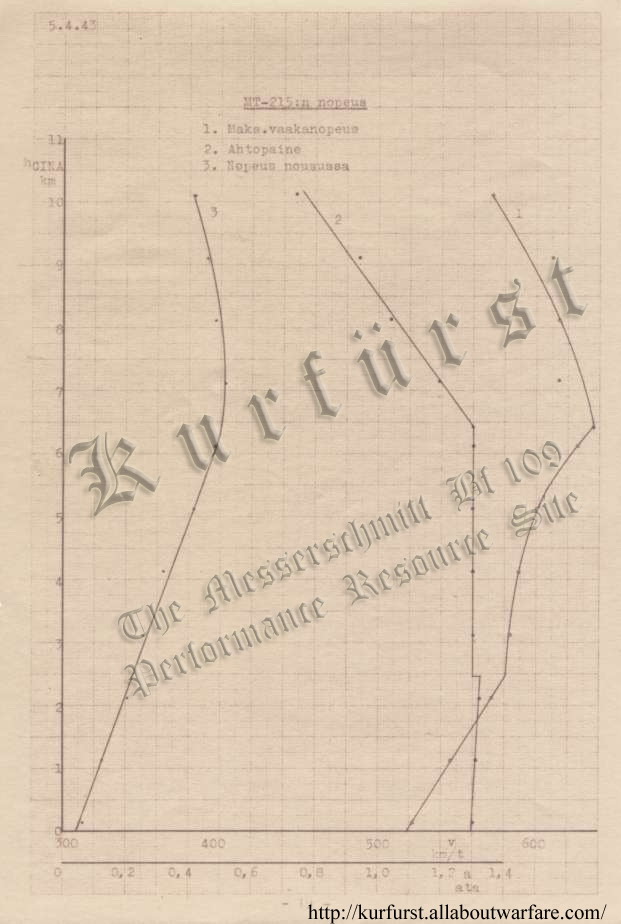
The third from the right, GJ + QA is soon to become MT-215. (Via Keskinen/Stenman/Niska.) The Finnish pilots flew the first 16 of the Bf 109Gs, numbered from MT-201 to MT-216, to Finnland by themselves, taking off from Wiener-Neustadt on the 10th of March 1943 and arrived in Helsinki three days later. 13 more G-2s were received in May. In total Finland received 48 G-2s which were numbered from MT-201 to MT-248, and 109 examples of the G-6 model (numbered from MT-401 to MT-514). The Finnish Air Force achieved 663 victories with the Messerschmitt Bf 109Gs during 1943 and 1944, while losing 32 fighters in combat or to anti-aircraft fire.16 aircraft were lost in accidents and 8 were destroyed on ground. 23 pilots were lost - an impressive exchange ratio of 25 : 1. MT-215 was assigned to 1/LeLv 34, and was piloted by Sgt. E. Peltola. It was tested on 5 April 1943 at Malmi while being flown Kapt. Pekka Kokko, performance trials were done between 12:15 and 13:05 on that day. The results of these tests are seen below. On 29 July 1943, the aircraft crashed. Up until that time, it scored 2 aerial victories, and logged 52 hours 30 mins of flight time. BELOW : MT-215, piloted by Capt. Lahtela, during it`s ferry flight to Finnland. Note the non-retractable tailwheel of these late production aircraft. (Via Keskinen/Stenman/Niska) 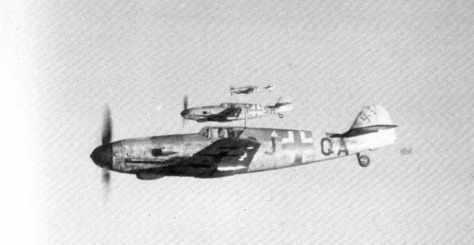 As a late production Bf 109G-2, WNr. 14 783 / MT-215 was fitted with an enlarged, non-retractable tailwheel as opposed to the previously retrractable one; this change caused -12km/h loss of speed at SL. This needs to be kept in mind when comparing the results with previous trials of the Bf 109G featuring retractable tailwheels. The then (March 1943) authorized maximum output of 1310 PS at 0km, ie. 100% throttle, Steig- und Kampfleistung, at a nominal 2600 R.P.M. and 1,3 ata MAP, were used through the tests. The results are noted to be corrected to CINA and for compressibility effects, various intrument errors. Test flights were performed in order to eliminate windage errors (these are not reproduced here). Maximum level Speed. Maximum speed achieved at SL was 522 km/h, and 636 km/h at 6,3 km altitude, and 552 km/h at 10 km altitude. During the tests, 1.3-1.32 ata and 2540 RPM was realized, though such small variations were within tolerance, the lower RPM and/or other factors appear to have somewhat impaired the supercharger`s performance, and thus may have reduced altitude performance, as seen from the performance curves : the rammed rated altitude of 6,3 km was considerably below not only the nominal value (of 7 km) of the DB 605 A, but also the typically obtained, avarage 6,6-6,7 km rated altitude. For this reason is it interesting to extrapolate the level speed curves of MT-215 to 7 km rated altitudes, which shows an extrapolated speed of ca. 650 km/h. The extrapolated values show matching result with those obtained on Bf 109G-4 WNr. 19 968, that was tested by the NII VVS in a very similiar configuration (ie. tailwheel was non-retractable in that case as well) in October 1943. This points to that the poor high altitude performance shown by MT-215 was likely to have been caused by a defective supercharger and/or lower supercharger speeds due to lower engine RPM.. Climb rate and time. Initial climb rates measured were 20.6 m/sec at SL, increasing to 24.7 m/sec at 1700m altitude. Climb to 5000m in ca. 4 min 6 secs. The climb results - 4 mins 6 seconds to 5km altitude - are in generally good agreement with the measurements of Bf 109G-1 trials at E-Stelle Rechlin (time to 5km : 4 min 11 seconds), at ERLA Flugzeugwerke in Germany (4 min 30 secs); as well as with the results obtained with the captured Bf 109G-2 WNr. 14 513, by the NII VVS in the USSR (4 min 24 secs). There`s, however a strong deviation, a 'spike' is displayed at ca. 1900m altitude compared to the aforementioned results, even though the shape of the climb curves follows closely the normal DB 605A-1 power curve characteristics. which develops it`s peak power output at around 2 km altitude in climbs, at the rated altitude of the supercharger`s 1. gear, or Bodenlader (M.S. gear FTH in RAF terms); all other Bf 109 test show the same phehomenon. The large scale deviation from other tests is observed from 0m up to ca. 2,5 km altitude, which prompted some, especially as it combined with a very impressive 24,7 m/sec (4860 fpm) peak climb rate for this particular Bf 109G, to dismiss the results as abberant. In contrast to the climb curve region of 0-2,5 m altitude, the curve follows closely the characteristic climb curve and values of other Bf 109G climb tests. The test report gives the explanation to the presence of this 'spike' - the effect of the 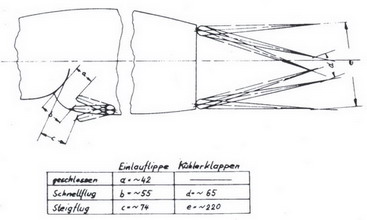 radiator flaps opening, and their varying drag, on climb
rate. radiator flaps opening, and their varying drag, on climb
rate. German calculations typically assume a standard radiator flap position, referred to as Steigflugstellung (or climbing position), at which the radiator`s exit flaps (Kühlerklappen) are open 220 mm wide, or apprx. half-open, and 74mm at the variable the inlet (Einlaufflippen), in order to provide imcreased airflow during the slow-speed climbs. Such measures would keep the coolant temperature low at an optimum 85 ○C value, but the engine itself would tolerate temperatures as much as 115 ○C safely up to 10 minutes duration, and the automatic thermostat not interfere up to 100 ○C temperature, which could be sustained indefinietely, as noted on page 4 of the DB 605 A-B Motoren-Karte, Ausgabe Oktober 1942 . The Steigflugstellung is assumed in the calculations up to the VDH (rated alt, FTH), after which it is assumed to gradually close to the minimum-drag Schnellflugstellung position, depicted on the right. This latter assumption was more like for practical purposes, to simplify drag calculations from the variable flap movements by assuming a constant, predictably decreasing value above the VDH, as opposed to the real-life behaviour of the automatically controlled radiator flaps which shut 1000-2500m above or even before climbing to the VDH in reality. The actual flight trials performed by Messerschmitt A.G. only vaguely follow such theoretical considerations; the position of the radiator flaps - and thus the measured performance - greatly varies between as little as 130-150mm and wide-open as 350mm. The Finnish trials of MT-215 are no exception. The report notes that climb speeds choosen for the trials were higher (300 km/h IAS) than prescribed in the manual for optimum climb speed (280 km/h). This resulted in higher speed airflow and more effective cooling for the radiators. As a result, it's noted that the radiator flaps would not open until the altitude of 2500 m was reached in climb, reducing drag considerably and resulting in increased rate of climb in the 0-2500 m altitude range - in short, a perfectly normal phenomenon, if we understand how airspeed, the cooling airflow, collant temperature, automatic thermostatically controlled, variable radiator exit flaps and their varying drag effects the flight performance of the Bf 109G. |
